igraph notes

话说这个学期基本都是没有什么目标的在学…基本在看机器学习和深度学习的东西, 但是一个学期过去了, 虽然没怎么去上课, 代码写了挺多的, 但是感觉到了最后没有收获太多东西, 绩点倒没有下降- -虽然这学期上课基本没听过讲…, 但是复习了一个月, 感觉代码水平又下降了(雾
说一下最近的事吧, 话说当时还在复习期末, 我们学院一位老师联系到我, 说想让我去他的实验室, 为研究生做打算…但是我也没有见过这位老师, 约了个时间, 然后考试完了后我就去找了老师, 谈了一下, 老师那边好像是要在他的实验室的话必须做他的研究生才行…但是我肯定是不会留在本校了, 所以和老师说了这点, 虽然老师说会培养我什么的…但是不太想留在本校了, 婉拒了老师. 然后回去弄美赛了, 第二天老师又联系到了我, 说可以破例让我去他实验室, 然后推荐了两本书给我, 方向是关于复杂网络的, 我这几天琢磨了一下, 感觉这个方向也挺适合我的, 把那两本书借来看了下, 感觉还是挺不错的, 总比现在漫无目的的看机器学习的书要好, 然后搜了一下复杂网络这块, 大致了解了下, 这里后续会做一些笔记, 不过就不在这里太多讨论了.
这篇作为复杂网路学习的第一篇学习笔记, 目前来看主要的可视化和计算工具有igraph, networkx, gephi等, 其中igraph有R, python, c++的实现, 看了下r的比较方便, 就直接拿r学习了, 好了不废话了, let’s start~
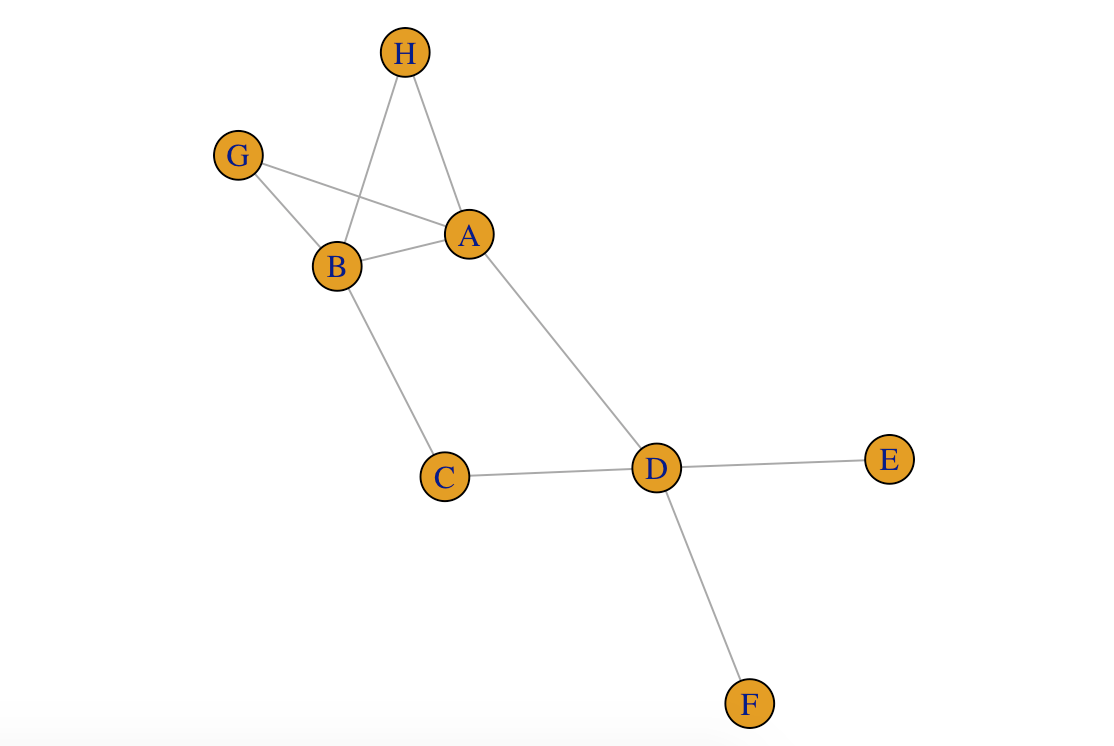
toy1 <- make_graph(~ A - B, B - C - D, D - E:F:A, A:B - G:H)
par(mar = c(0,0,0,0))
plot(toy1)


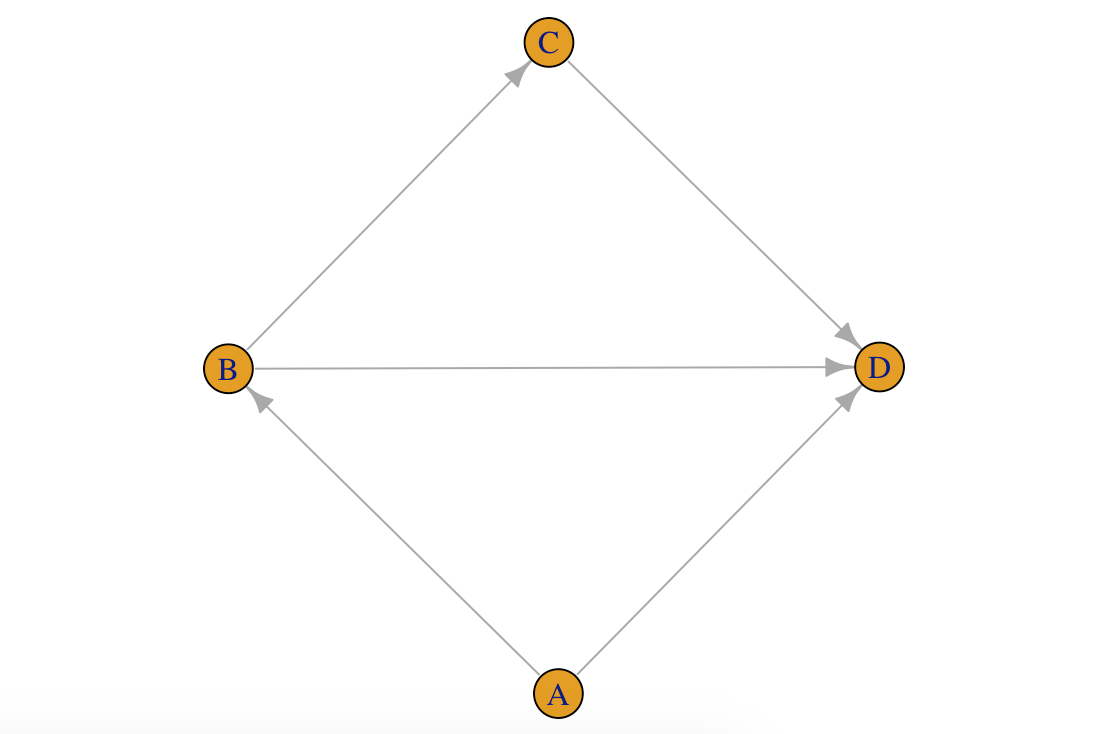
toy2 <- make_graph(~ A -+ B, B -+ C -+ D +- A:B)
par(mar = c(0,0,0,0))
plot(toy2)

make_ring(5)
A <- matrix(sample(0:1, 100, replace = TRUE), nrow = 10)
toy3 <- graph_from_adjacency_matrix(A)

L <- matrix(sample(1:10, 20, replace = TRUE), ncol = 2)
toy4 <- graph_from_edgelist(L)

edges <- data.frame(
  stringsAsFactors = FALSE,
  from = c("BOS", "JFK", "LAX"),
  to   = c("JFK", "LAX", "JFK"),
  Carrier = c("United", "Jetblue", "Virgin America"),
  Departures = c(30, 60, 121)
)
vertices <- data.frame(
  stringsAsFactors = FALSE,
  name = c("BOS", "JFK", "LAX"),
  City = c("Boston, MA", "New York City, NY",
           "Los Angeles, CA")
)

toy5 <- graph_from_data_frame(edges, vertices = vertices)
as_data_frame(toy5, what = "edges")
as_data_frame(toy5, what = "vertices")
as_long_data_frame(toy5)
V(USairports)[[1:5]]
E(USairports)[[1:5]]

is_simple(USairports)
sum(which_multiple(USairports))
sum(which_loop(USairports))

air <- simplify(USairports, edge.attr.comb =
                  list(Departures = "sum", Seats = "sum", Passengers = "sum", "ignore"))
is_simple(air)

#The [ operator treats the graph as an adjacency matrix.
#The [[ operator treats the graph as an adjacency list.
air["BOS", "JFK"]
air["BOS", "ANC"]
air[c("BOS", "JFK", "ANC"), c("BOS", "JFK", "ANC")]

E(air)$weight <- E(air)$Passengers
air["BOS", "JFK"]

air[["BOS"]]

air[[, "BOS"]]

#Manipulation
#add
air["BOS", "ANC"] <- TRUE
air["BOS", "ANC"]
#remove
air["BOS", "ANC"] <- FALSE
air["BOS", "ANC"]

g <- make_empty_graph(10)
g[-1, 1] <- TRUE
g

# add vertices

g <- make_ring(10) + 2
par(mar = c(0,0,0,0)); plot(g)

# add vertices with attributes

g <- make_(ring(10), with_vertex_(color = "grey")) +
  vertices(2, color = "red")
par(mar = c(0,0,0,0)); plot(g)

# add an edge
g <- make_(star(10), with_edge_(color = "grey")) +
  edge(5, 6, color = "red")
par(mar = c(0,0,0,0));
plot(g)

#Add a chain of edges
g <- make_(empty_graph(5)) + path(1,2,3,4,5,1)
g2 <- make_(empty_graph(5)) + path(1:5, 1)
g
plot(g)

#create a wheel
#my solution
g <- make_graph(~ 11 - 1:2:3:4:5:6:7:8:9:10) + path(2:11,2)
plot(g)
#other solution
g <- make_star(11, center = 11, mode = "undirected") + path(1:10, 1)
plot(g)

#vertices expression
V(air)
V(air)[1,2:5]
#select
V(air)[degree(air) < 2]
#neighbours of vertices
V(air)[nei('BOS')]
#select
V(air)['BOS', 'JFK']

#for edges
E(air)
#Edges between two vertex sets
E(air)['BOS' %--% 'SJU']
#Edges between two vertex sets, directionally
E(air)['BOS' %->% 'SJU']
#Edges along a path
E(air, path = P)
#Incoming edges of a vertex
E(air)[to('BOS')]
#Outgoing edges of a vertex
E(air)[from('BOS')]

# manipulation

FL <- V(air)[grepl("FL$", City)]
CA <- V(air)[grepl("CA$", City)]

V(air)$color <- "grey"
V(air)[FL]$color <- "blue"
V(air)[CA]$color <- "blue"
plot(air)

E(air)[FL %--% CA]

E(air)$color <- "grey"
E(air)[FL %--% CA]$color <- "red"


V(air)[[1:5]]

set.seed(42)
g <- sample_gnp(12, 0.25)

pa <- V(g)[11, 2, 12, 8]

V(g)[pa]$color <- 'green'
E(g)$color <- 'grey'
E(g, path = pa)$color <- 'red'
E(g, path = pa)$width <- 3
plot(g)

# 最短路
air <- delete_edge_attr(air, "weight")
distances(air, 'PBI', 'ANC')

sp <- shortest_paths(air, 'PBI', 'ANC', output = "both")
sp

all_shortest_paths(air, 'PBI', 'ANC')$res

#加权路径
wair <- simplify(USairports, edge.attr.comb =
                   list(Departures = "sum", Seats = "sum", Passangers = "sum",
                        Distance = "first", "ignore"))
E(wair)$weight <- E(wair)$Distance

#最短距离
distances(wair, c('BOS', 'JFK', 'PBI', 'AZO'),
          c('BOS', 'JFK', 'PBI', 'AZO'))
shortest_paths(wair, from = 'BOS', to = 'AZO')$vpath
all_shortest_paths(wair, from = 'BOS', to = 'AZO')$res

#平均距离
mean_distance(air)

#距离矩阵
air_dist_hist <- distance_table(air)
air_dist_hist

par(mar = c(5,4,4,2)+0.1)
barplot(air_dist_hist$res, names.arg = seq_along(air_dist_hist$res))

#components 连通量? 强连通和弱连通
co <- components(air, mode = "weak")
co$csize
#弱连通分析?
groups(co)[[2]]
#强连通
co <- components(air, mode = "strong")
co$csize

#Bow-tie structure of a directed graph
#
#
#
#
#
#
#


#Centrality
#Finding important vertices in the network (family of concepts)
V(kite)$label.cex <- 2
V(kite)$color <- V(kite)$frame.color <- "grey"
V(kite)$size <- 30
par(mar=c(0,0,0,0)) ; plot(kite)

d <- degree(kite)
par(mar = c(0,0,0,0))
plot(kite, vertex.size = 10 * d, vertex.label =
       paste0(V(kite)$name, ":", d))
#Classic centrality measures: closeness
cl <- closeness(kite)
#到达中心的平均步数
par(mar=c(0,0,0,0)); plot(kite, vertex.size = 500 * cl)

#Classic centrality measures: betweenness
btw <- betweenness(kite)
btw
par(mar=c(0,0,0,0)); plot(kite, vertex.size = 3 * btw)

#93 pages do it next time...not that understand the concept..
随便贴两张图吧…中间生成的图比较多, 在整理比较麻烦, 后续会多整理下. s
s