美赛选拔试题解
用mathematica写成, 最后一题图像镇楼..(洛伦兹吸引子确实神奇..
第一题
- 3000组城市坐标, 并在10000x10000$m^2$的范围内生成
p = RandomReal[10000, {3000, 2}];
ListPlot[p]
result = FindShortestTour[p];
result[[1]]
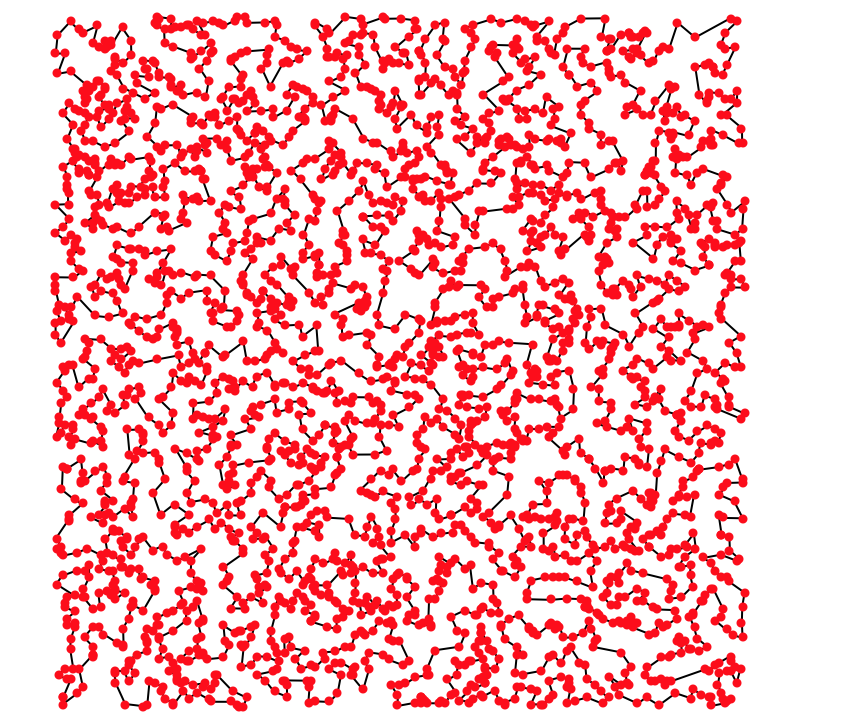
Graphics[{Line[p[[Last[result]]]], PointSize[Medium], Red, Point[p]}]
生成的3000个城市的坐标分布如下
所得TSP最优路径如下
- 30000组城市坐标, 并在100000的距离范围内生成
p = RandomReal[100000, {30000, 2}];
ListPlot[p]
result = FindShortestTour[p];
result[[1]]
Graphics[{Line[p[[Last[result]]]], PointSize[Medium], Red, Point[p]}]
生成的30000组城市坐标分布如下
结果如下
求解时间6S左右, 在显示方面由于点数过多过于密集
在实数域上, 生成范围的大小一般和分布没关系, 此处生成的平面大小只是为了计算路径总距离.
第二题
- 一维的情况下, 假设将一个100度的棍子丢入一个0度的水池里, 棍子除了两端都完全绝热, 那么在此棍轴上温度随时间变化以传可以求得
Manipulate[
Module[{l, f},
l = 1;
f[x_, t_] :=
NSum[(400/(n*\[Pi])) Sin[(n*\[Pi]*x)/
l] E^(-k ((n*\[Pi])/l)^2 t) , {n, 1, m, 2}];
Plot3D[f[x, t], {x, 0, 1}, {t, 0, 2}, FaceGrids -> All,
PlotRange -> {{0, 1}, {0, 2}, {0, 150}},
PlotStyle -> Directive[Orange, Specularity[White, 30]],
PlotPoints -> ControlActive[4, 20],
AxesLabel -> {"length", "time", "temperature"},
ImageSize -> {400, 400}]],
{{k, .1, "conductivity parameter k"}, .01, .5,
Appearance -> "Labeled"},
{{m, 1, "number of terms n"}, 1, 47, 2, Appearance -> "Labeled"},
TrackedSymbols :> {k, m}]
```
此图的横轴是棍子轴向距离, 纵轴是时间, 高度是温度, 设置两个参数的不同, 结果也会随之不同.


此处随机选取了两组参数, 可以看到棍子在轴向上的温度随参数的不同而降温速度也会不同.
- 对二维的情况对一个1X1的长方形面板, 其表面上全部温度为1度, 四周的温度为0度,热扩散为$1cm^2/s$, 有
```mathematica
Manipulate[
Module[{a, f},
a = Flatten[
Table[{1/2 (y[i] + 1), 1/2 (y[j] + 1), tbl[[i + 1, j + 1]]}, {i,
0, Np}, {j, 0, Np}], 1] /. t -> ta; f = Interpolation[a];
af[te_] :=
Flatten[Table[{1/2 (y[i] + 1), 1/2 (y[j] + 1),
tbl[[i + 1, j + 1]]}, {i, 0, Np}, {j, 0, Np}], 1] /. t -> te;
ff[te_] := Interpolation[af[te]];
Pane[Row[{
ContourPlot[f[x1, y1], {x1, 0, 1}, {y1, 0, 1}, Contours -> 10,
FrameLabel -> {Style["x", 16, Italic], Style["y", 16, Italic]},
ColorFunctionScaling -> False, ContourLabels -> True,
ColorFunction -> (ColorData["TemperatureMap"][#] &),
ImageSize -> {300, 400}],
Spacer[20],
DensityPlot[y, {x, 0, 1}, {y, 0, 1},
PlotRange -> {{0, 1}, {0, 1}}, ColorFunctionScaling -> False,
AspectRatio -> 10,
ColorFunction -> (ColorData["TemperatureMap"][#] &),
Frame -> True,
FrameLabel -> {None, None , None,
Style["dimensionless temperature", 16]},
FrameTicks -> {None, None,
None, Table[{r, NumberForm[r, {2, 1}]}, {r, 0, 1, 0.1}]},
Axes -> None,
LabelStyle -> 16, ImageSize -> {120, 340},
ImagePadding -> {{20, 80}, {Automatic, Automatic}}],
Spacer[20]}], Alignment -> Center,
ImageSize -> {480, 400}]], {{ta, 0.028, "dimensionless time"},
0.005, 0.2, 0.001, Appearance -> "Labeled",
Enabled -> If[ctrl == 1, True, False]},
TrackedSymbols :> {ta, ctrl},
Initialization :> {
Np = 20;
Ds = Table[d[i, j], {i, 0, Np}, {j, 0, Np}];
d[0, 0] = (2 Np^2 + 1)/6 // N;
d[Np, Np] = -(2 Np^2 + 1)/6 // N;
d[i_, i_] := -y[i]/(2 (1 - y[i]^2));
y[i_] := Cos[i Pi/Np] // N;
d[j_, k_] := If[j != k, c[j] (-1)^(j + k)/(c[k] (y[j] - y[k]))];
c[i_] := If[i == 0 || i == Np, 2, 1];
D1 = Ds.Ds; D2 = Table[D1[[i, j]], {i, 2, Np}, {j, 2, Np}];
L = KroneckerProduct[D2, IdentityMatrix[Np - 1]] +
KroneckerProduct[IdentityMatrix[Np - 1], D2];
U = Table[
u[i + (j - 1) (Np - 1)][t], {j, 1, Np - 1}, {i, 1, Np - 1}] //
Flatten;
Eq[i_] := u[i]'[t] == 4 L[[i]].U;
sys = Table[Eq[i], {i, 1, (Np - 1)^2}];
init = Table[u[i][0] == 1, {i, 1, (Np - 1)^2}];
sol = NDSolve[{sys, init}, U, {t, 0, 0.5}];
tbl = Join[{Table[0, {i, 1, Np + 1}]},
Table[Join[{0},
Table[u[i + (j - 1) (Np - 1)][t] /. sol // First, {i, 1,
Np - 1}], {0}], {j, 1, Np - 1}], {Table[
0, {i, 1, Np + 1}]}]}]
如下为0.019秒后的
0.0103秒后, 有
第三题
在参数为$\sigma=10,\beta=28,\lambda=\frac{8}{3}$,$[x(0),y(0),z(0)]=[5,13,17]$的情况下, 求解lorenz微分方程组.
NDSolve[{x'[t] == -10 (x[t] - y[t]),
   y'[t] == -x[t] z[t] + 28 x[t] - y[t],
   z'[t] == x[t] y[t] - 8/3*z[t], x[0] == 5, z[0] == 17,
   y[0] == 13}, {x, y, z}, {t, 0, 200}, MaxSteps -> Infinity];
ParametricPlot3D[Evaluate[{x[t], y[t], z[t]} /. %], {t, 0, 200},
 PlotPoints -> 10000, ColorFunction -> (ColorData["Rainbow"][#4] &)]
利用参数法绘制出解的图形如下
