skimage
今天看了一下skimage这个库, 感觉比自带的PIL库好用些, 下面写了一点trivial的例子,
一开始想要把图片转成灰色的, 找了半天没有找到rgb2gray…

然后google了一下 发现skimage 的color里面有这个函数..不过里面的参数貌似和matlab不一样, 不过效果感觉差不多
然后测试了一下
from skimage import data, color
import matplotlib.pyplot as plt
cat = data.chelsea()
plt.imshow(color.rgb2gray(cat))
plt.show()
结果迷之图像…
查了一下文档, 貌似是给出的亮度luminance,
于是只用在plt.imshow里面设置一下参数就行了,
如下
from skimage import data, color
import matplotlib.pyplot as plt
cat = data.chelsea()
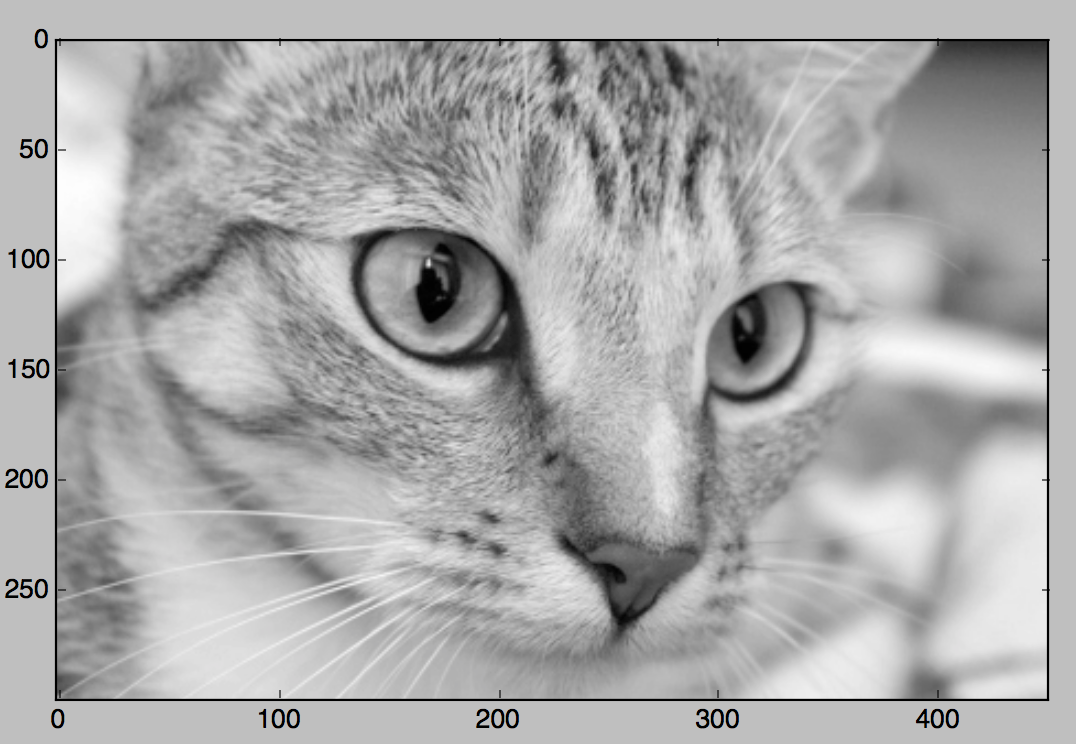
plt.imshow(color.rgb2gray(cat), cmap = 'gray')
plt.show()

OK~
Trivial Example
import numpy as np
from matplotlib import pyplot as plt
from skimage import data, img_as_float, color, exposure
from skimage.restoration import unwrap_phase


# Load an image as a floating-point grayscale
image = color.rgb2gray(img_as_float(data.chelsea()))
# Scale the image to [0, 4*pi]
image = exposure.rescale_intensity(image, out_range=(0, 4 * np.pi))
# Create a phase-wrapped image in the interval [-pi, pi)
image_wrapped = np.angle(np.exp(1j * image))
# Perform phase unwrapping
image_unwrapped = unwrap_phase(image_wrapped)

fig, ax = plt.subplots(2, 2, sharex=True, sharey=True, subplot_kw={'adjustable':'box-forced'})
ax1, ax2, ax3, ax4 = ax.ravel()

fig.colorbar(ax1.imshow(image, cmap='gray', vmin=0, vmax=4 * np.pi), ax=ax1)
ax1.set_title("Old Wang's original Cat")

fig.colorbar(ax2.imshow(image_wrapped, cmap='gray', vmin=-np.pi, vmax=np.pi),
             ax=ax2)
ax2.set_title("Old Wang's Wrapped phase Cat")

fig.colorbar(ax3.imshow(image_unwrapped, cmap='gray'), ax=ax3)
ax3.set_title("Old Wang's Cat After phase unwrapping")

fig.colorbar(ax4.imshow(image_unwrapped - image, cmap='gray'), ax=ax4)
ax4.set_title("Old Wang's Unwrapped minus original Cat")


# Create a simple ramp
image = np.ones((100, 100)) * np.linspace(0, 8 * np.pi, 100).reshape((-1, 1))
# Mask the image to split it in two horizontally
mask = np.zeros_like(image, dtype=np.bool)
mask[image.shape[0] // 2, :] = True

image_wrapped = np.ma.array(np.angle(np.exp(1j * image)), mask=mask)
# Unwrap image without wrap around
image_unwrapped_no_wrap_around = unwrap_phase(image_wrapped,
                                              wrap_around=(False, False))
# Unwrap with wrap around enabled for the 0th dimension
image_unwrapped_wrap_around = unwrap_phase(image_wrapped,
                                           wrap_around=(True, False))

fig, ax = plt.subplots(2, 2)
ax1, ax2, ax3, ax4 = ax.ravel()

fig.colorbar(ax1.imshow(np.ma.array(image, mask=mask), cmap='rainbow'), ax=ax1)
ax1.set_title('Original')

fig.colorbar(ax2.imshow(image_wrapped, cmap='rainbow', vmin=-np.pi, vmax=np.pi),
             ax=ax2)
ax2.set_title('Wrapped phase')

fig.colorbar(ax3.imshow(image_unwrapped_no_wrap_around, cmap='rainbow'),
             ax=ax3)
ax3.set_title('Unwrapped without wrap_around')

fig.colorbar(ax4.imshow(image_unwrapped_wrap_around, cmap='rainbow'), ax=ax4)
ax4.set_title('Unwrapped with wrap_around')

plt.show()

great!
对于3D绘图
from mpl_toolkits.mplot3d import axes3d
import matplotlib.pyplot as plt
from matplotlib import cm

fig = plt.figure()
ax = fig.gca(projection='3d')
X, Y, Z = axes3d.get_test_data(0.05)
ax.plot_surface(X, Y, Z, rstride=8, cstride=8, alpha=0.3)
cset = ax.contourf(X, Y, Z, zdir='z', offset=-100, cmap=cm.coolwarm)
cset = ax.contourf(X, Y, Z, zdir='x', offset=-40, cmap=cm.coolwarm)
cset = ax.contourf(X, Y, Z, zdir='y', offset=40, cmap=cm.coolwarm)

ax.set_xlabel('X')
ax.set_xlim(-40, 40)
ax.set_ylabel('Y')
ax.set_ylim(-40, 40)
ax.set_zlabel('Z')
ax.set_zlim(-100, 100)

plt.show()

一样无比强大, 感觉有点比上mathematica了, 效果很不错
本来看了一下r的ggplot2包画的图很不错,虽然julia的gadfly的效果也是模仿ggplot2的但是最近还是感觉julia用的有点不爽 各种包用的确实麻烦, 每次都要提前编译, 感觉比python都慢了, 虽然说编译好了后确实速度快乐不少.
慢慢学习吧~~~