图论高级算法及实现
现在对一个图主要的计算基本有
- 哈密顿回路
- TSP
- postman
- 欧拉图
- 最大流
- 最小花费最大流
下面做实例
练习同时做保存
最大流
Based on a 1940 Soviet railway network, find the maximum amount of cargo that can be transported from sources in the Western Soviet Union to destinations in Eastern European countries.
eg:
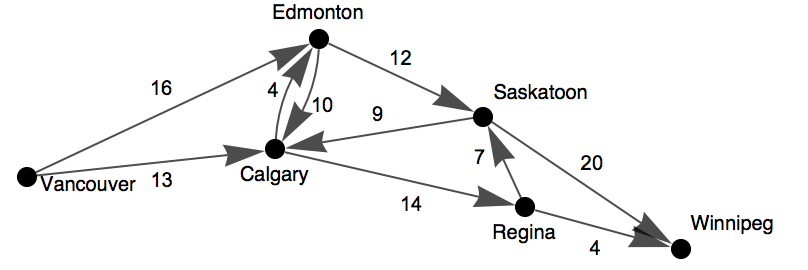
原始图
data=
  FindMaximumFlow[g, "Vancouver", "Winnipeg", "OptimumFlowData"];

  Grid[{#, data[#]} & /@ \[ScriptCapitalF]["EdgeList"],Frame -> All, Alignment -> Left]

 makelabels[railway_, data_] :=
  Block[{edgecap = EdgeCapacity /. Options[railway, EdgeCapacity]},
   Map[(# ->
       Framed[Style[
         Row[{edgecap[[EdgeIndex[railway, #]]], "/", data[#]}],
         Directive[8.2, FontFamily -> "Helvetica"]],
        FrameMargins -> {{-.2, -.2}, {-.7, -.7}},
        Background -> GrayLevel[.9], FrameStyle -> None]) &,
    data["EdgeList"]]];


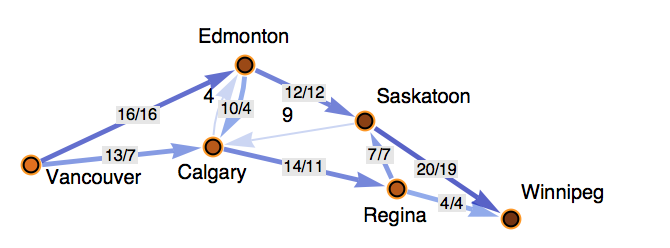
SetProperty[\[ScriptCapitalF][
  "FlowGraph"], {EdgeLabels -> makelabels[g, \[ScriptCapitalF]]}]
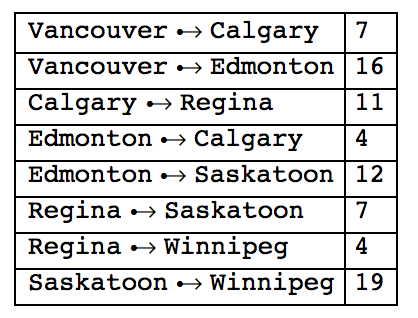
maxflow matrix
maxflow graph
哈密顿回路
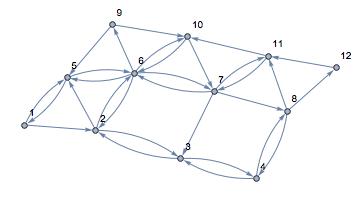
以一个简单有向最短路为例
data = SparseArray[{{1, 2} -> 150, {1, 5} -> 165, {2, 3} ->
     130, {2, 5} -> 230, {2, 6} -> 160, {3, 2} -> 140, {3, 4} ->
     100, {4, 3} -> 100, {4, 8} -> 190, {5, 1} -> 165, {5, 6} ->
     144, {6, 2} -> 170, {6, 5} -> 144, {6, 7} -> 128, {6, 9} ->
     218, {6, 10} -> 174, {7, 3} -> 200, {7, 6} -> 122, {7, 8} ->
     109, {7, 11} -> 185, {8, 4} -> 180, {8, 11} -> 141, {8, 12} ->
     190, {9, 10} -> 148, {9, 5} -> 194, {10, 6} -> 174, {10, 7} ->
     233, {11, 7} -> 185, {11, 10} -> 135, {12, 11} -> 110}, {12, 12},
    Infinity] // Normal
graph = WeightedAdjacencyGraph[data, VertexLabels -> "Name"]
one answer

稀疏矩阵生成有向图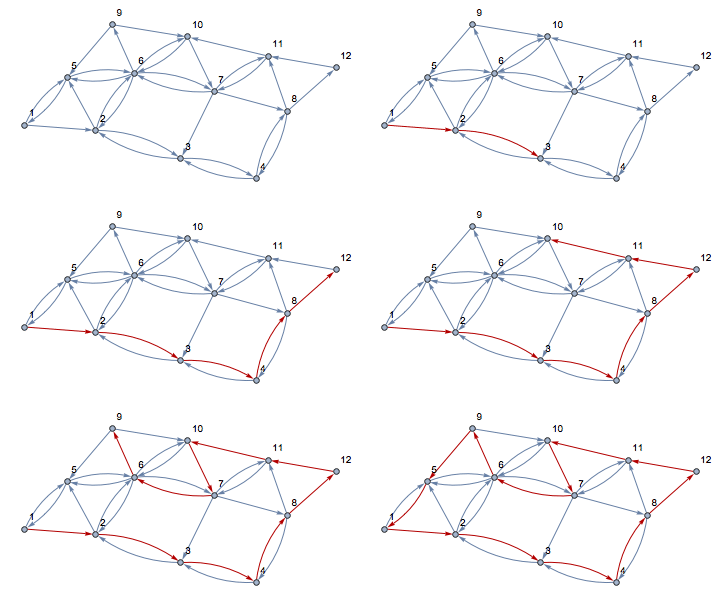
ans1 = FindHamiltonianCycle[graph, All]
Table[HighlightGraph[graph, ans1[[1, 1 ;; i]]], {i, 0,
  Length[ans1[[1]]]}]
postman
ans1 = FindPostmanTour[graph]
Table[HighlightGraph[graph, ans1[[1, 1 ;; i]]], {i, 0,
  Length[ans1[[1]]]}]
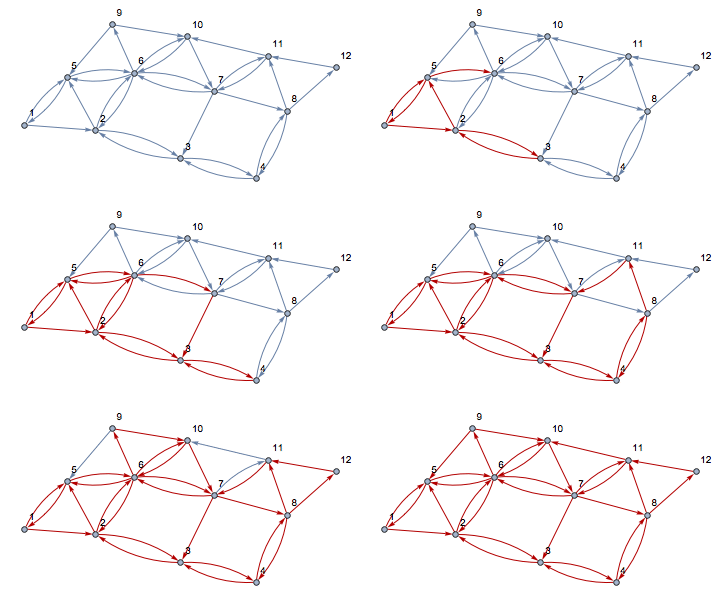
印度地图的一个postman
图片貌似出问题了…
下次补充吧
TSP
类似
不再赘述
用FindShortestTour
单源最短路等可以用FindShortestPath
其中参数可以用All.
余下慢慢补充(大雾)(PS… 感觉写并且总结这些也挺花功夫的= =..还有好多今天写的没有写上来 以后熟练点应该会好点吧))
